Indifference Curves and Budget Constraints > Normal Preferences

Solution

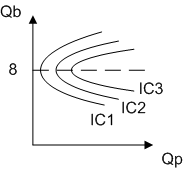
  1. Ralph's indifference curves might look like this:

    For any given amount of beer, increasing his amount of pizza moves him to higher indifference curves. For any given amount of pizza, however, more beer only moves him to higher indifference curves until Qb=8; after that, more beer moves him back down to lower indifference curves.
  2. With beer on the vertical axis, the slope of his indifference curve is -2 (that is, -2 cans of beer/1 pizza). If you put pizza on the vertical axis, the slope is -0.5 (that is, 1 pizza/-2 cans of beer).
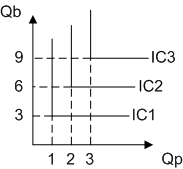
  3. In this case, Ralph regards the goods as perfect complements. His indifference curves look like this:

Site Index | Zoom | Admin
URL: https://wilcoxen.maxwell.insightworks.com/pages/1337.html
Peter J Wilcoxen, The Maxwell School, Syracuse University
Revised 11/02/2004