
The Maxwell School
Syracuse University
Syracuse University
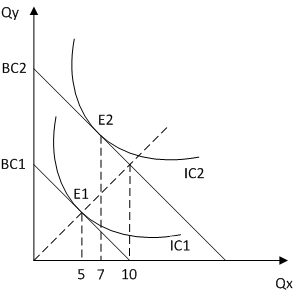
The diagrams below show the link between a household's preferences, as shown by its indifference curves, and its income elasticity of demand for the X good. In each diagram, there are two budget constraints BC1 and BC2. Under BC1, the household has $180 to spend and under BC2 it has twice as much: $360. Points E1 and E2 show the equilibrium consumption bundles the household chooses under each of the budget constraints. IC1 and IC2 are the corresponding indifference curves.
Under one possible set of preferences, shown by IC1 and IC2 in the figure below, the household's consumption of X is proportional to its income: doubling income from $180 to $360 causes the household to double its consumption of X from 5 to 10 units. The dashed line is shown for reference and indicates all of the points where consumption of X is proportional to income (not just those for $180 and $360).

The income elasticity for this case is equal to 1 (hence the term unitary income elasticity) because the percentage change in X divided by the percentage change in income is 100%/100% = 1. Goods having a unitary income elasticity are a subcategory of "normal" goods.
Alternatively, preferences could take the form shown below. In this case, doubling income results in the consumption of X more than doubling. The income elasticity is 140%/100% = 1.4. The dashed line from Case 1 is shown for reference to make the diagrams easier to compare. The key feature of this case is that E2 is to the right (more consumption of X) of the point where the dashed line intersects BC2.
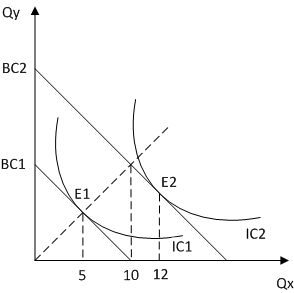
Goods with an income elasticity greater than 1 are known as "luxury" goods, and they are a subcategory of "normal" goods.
A third possibility is that preferences take the form shown below. In this case, doubling income causes X to rise but less than in proportion to income. The income elasticity is 40%/100% = 0.4. As before, the dashed is shown for reference.
The final possibility is that preferences take the form in the diagram below. In this case, the increase in income actually causes consumption of X to decline. The income elasticity of the demand for the X good is -40%/100% = -0.4. Goods with income elasticities less than 0 are known as "inferior" goods because consumption of the good decreases when income increases.

The table below summarizes the four cases:
| Case | Income Elasticity | Narrow Term | Broad Category |
| 1 | η = 1 | Unitary | Normal |
| 2 | η > 1 |
Luxury | |
| 3 | 1 > η > 0 |
Necessity | |
| 4 | η < 0 |
Inferior | Inferior |