
The Maxwell School
Syracuse University
Syracuse University
The overall graph of the market looks like this:

To see where the changes in CS and the domestic and foreign PS are, it's easier to look at the individual diagrams for consumers and both types of producer. Relative to no quota, consumers lose A+B of CS:

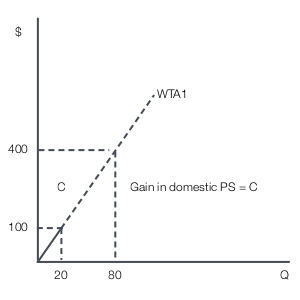
Relative to no quota, domestic producers gain PS equal to C:
Again, relative to no quota foreign producers gain PS equal to D:
